

By PipeLedger · Published · Updated

A growing development business needed a shared financial picture
Los Angeles-based Ome Dezin restores character-driven sanctuaries with thoughtful design and contemporary livability. After years in real estate development, the team began professionalizing its operations in 2025 as it took on larger, lender-financed projects with more co-investors, lenders, and contractors. Clear legal structures, owner protection, and project-level accountability became top priorities.
Ome Dezin was already using QuickBooks. What it needed next was help managing financial data across multiple LLCs, including the holding company, and bringing their results together. The owners wanted a clear answer to two questions: what has each project contributed individually, and what are the company results? They needed one project overview that made sense from purchase through development and sale, without having to understand how the accountant recorded each cost.
As Ome Dezin attracted co-investor capital, the team needed financial results it could explain with confidence. Funding, reimbursements, and loans between the LLCs repeatedly reopened reconciliation questions, leaving the owners without a clear explanation of what each project had earned or where the money belonged.
The team invested in a shared financial data warehouse, combined reporting across the LLCs, and AI-assisted controller review. The goal was a consistent view of project and company results, with accounting differences that could be traced back to the records and resolved.
One reporting template for every project
Every Ome Dezin project reports through the same template. The Finance Catalog groups the chart of accounts into four Catalog Categories shared by all projects: Revenue, Acquisition Cost, Development Cost, and Financing Cost. Development Cost is split further into Catalog Subcategories for hard costs, soft costs, carrying costs, and closing costs. These groupings are defined once and applied to every project, so a completed sale, an active renovation, and a newly acquired property can be read through the same lines.
Ome Dezin’s earlier spreadsheet template carried rising admin costs and could not keep up once several projects ran at the same time with different funding arrangements and cost treatments. Investing in a data warehouse and PipeLedger made sense. The replacement lives in the Finance Catalog rather than in the books. QuickBooks keeps its own account hierarchy; the controller assigns each account a Catalog Category and Catalog Subcategory that say what the cost means to the business. A property tax bill and an architect’s invoice both land in Development Cost, one under carrying costs and the other under soft costs, without renaming anything in QuickBooks. The amounts below are illustrative; the structure is the real template.
| Catalog Category (L4) | Catalog Subcategory (L5) | Example accounts | Illustrative amount |
|---|---|---|---|
| Revenue | Real Estate Sales Revenue | Sale of property | 5,250,000 |
| Acquisition Cost | Property acquisition release | Project acquisition cost release | (3,600,000) |
| Development Cost | Hard costs - general contractor | General contractor; General contractor - landscaping, pool, roofing; General contractor - paint/stucco, flooring | (560,000) |
| Development Cost | Hard costs - materials & supplies | Furniture & staging; Supplies - cabinetry; Appliances; Supplies - floors, tiles, lighting, plumbing | (285,000) |
| Development Cost | Soft costs - Architect, engineering & AV | Professional fees - architect/creative; General contractor - Audio / Visual (AV) | (55,000) |
| Development Cost | Carrying costs - tax / insurance / utilities | Property taxes and transfer taxes; Insurance; Utilities | (95,000) |
| Development Cost | Closing, title, escrow, legal | Realtor commission; Title & escrow costs; Inspection costs | (240,000) |
| Financing Cost | Financing Cost | Financing charges | (90,000) |
| Project result | 325,000 |
Two cost definitions follow from the template. Development Cost is everything in the Development Cost category across both expense and asset accounts, so development spending can be compared across projects whichever treatment applied; Acquisition Cost and Financing Cost stay outside it. Total Project Cost is broader: recorded project expenses plus the capitalized costs still held as assets, including acquisition. When a capitalized cost is released to cost of goods sold at sale, the asset falls and the expense rises by the same amount, so the total counts that cost once. The implementation guide includes a worked cost-release example.
The definitions behind the project results
We publish how customers use PipeLedger so that other teams can reuse the same approach. The definitions below are the ones Ome Dezin runs.
A property can take more than a year to develop. Real estate developers therefore capitalize eligible project costs: they hold those costs as assets during development and recognize them as expense when the property is sold. Other costs may be expensed as incurred. The controller needs to follow both treatments across the full project lifecycle.
PipeLedger’s Finance Catalog turns the controller’s definitions into reusable measures. Each measure specifies the accounts to include, the period to cover, and how to calculate the result. Ome Dezin can apply those definitions across its projects without maintaining a separate spreadsheet formula for each one.
For Ome Dezin, three definitions mattered most. Development Cost had to be measured from the template’s catalog categories, whether a cost was expensed or capitalized. Total Project Cost had to hold across costing methods, combining expensed costs with the capitalized costs still on the balance sheet. And because co-investors fund projects alongside the owners, contributed capital had to be selected account by account, so that Project ROE uses only the approved contribution accounts. The Finance Catalog handles all three:
| Metric | Description | PipeLedger technical formula | What it supports |
|---|---|---|---|
| Development Cost | Development costs across approved asset and expense accounts, excluding acquisition and separately classified financing costs. | development_cost = SUM_WINDOW(mart_gl_lines)include: taxonomy_level_4_catalog = Development Costwindow: lifetime | Compare development spending across projects, whether costs are expensed or capitalized. |
| Total Project Cost | The project’s recorded cost through the reporting date, including acquisition. | ome_total_project_cost = ome_project_capitalized_cost_activity + ome_project_cost_expenseswindow: lifetime | Follow costs through development and sale without counting a matched cost release twice. |
| Project Return on Equity (ROE) | Lifetime accounting return on the capital contributed to the project; not annualized. | ome_project_roe = SUM_WINDOW(net_income) / SUM_WINDOW(ome_project_equity_contributions)ome_project_equity_contributions: account_id in approved contribution accounts, credit-positivewindow: lifetimeannualization: noneunit: percentage | Keep invested capital visible when assessing returns, even after it has been repaid. |
| Return on Project Cost | Lifetime accounting profit relative to total project cost; not annualized. | ome_project_return_on_cost = SUM_WINDOW(net_income) / SUM_WINDOW(ome_total_project_cost)window: lifetimeannualization: noneunit: percentage | Compare the profit earned relative to the recorded cost of each project. |
The formula column mirrors the workspace Metrics tab. Lowercase identifiers are Finance Catalog metric IDs: canonical metrics such as net_income and total_equity, and the ome_ definitions Ome Dezin authored for its own business, which another developer can adapt to their own accounts. Uppercase functions are PipeLedger metric calculation types, and the detail lines carry each metric’s window, annualization, and membership settings. This is a readable rendering of the catalog configuration, not a free-form formula to paste into a derived metric. The returns are accounting returns on recorded balances, not investor cash-flow IRRs.
From project reports to consolidated project overviews
Each project report rolls up into one Project Overview across all LLCs. Every row is a project. Every column is a definition from section 2: revenue, cost of goods sold, expenses, profit, Total Project Cost, Development Cost, Project ROE, and Return on Project Cost. The chart above the table plots each project’s total cost against its operating profit, so the portfolio can be read at a glance before anyone opens a row.
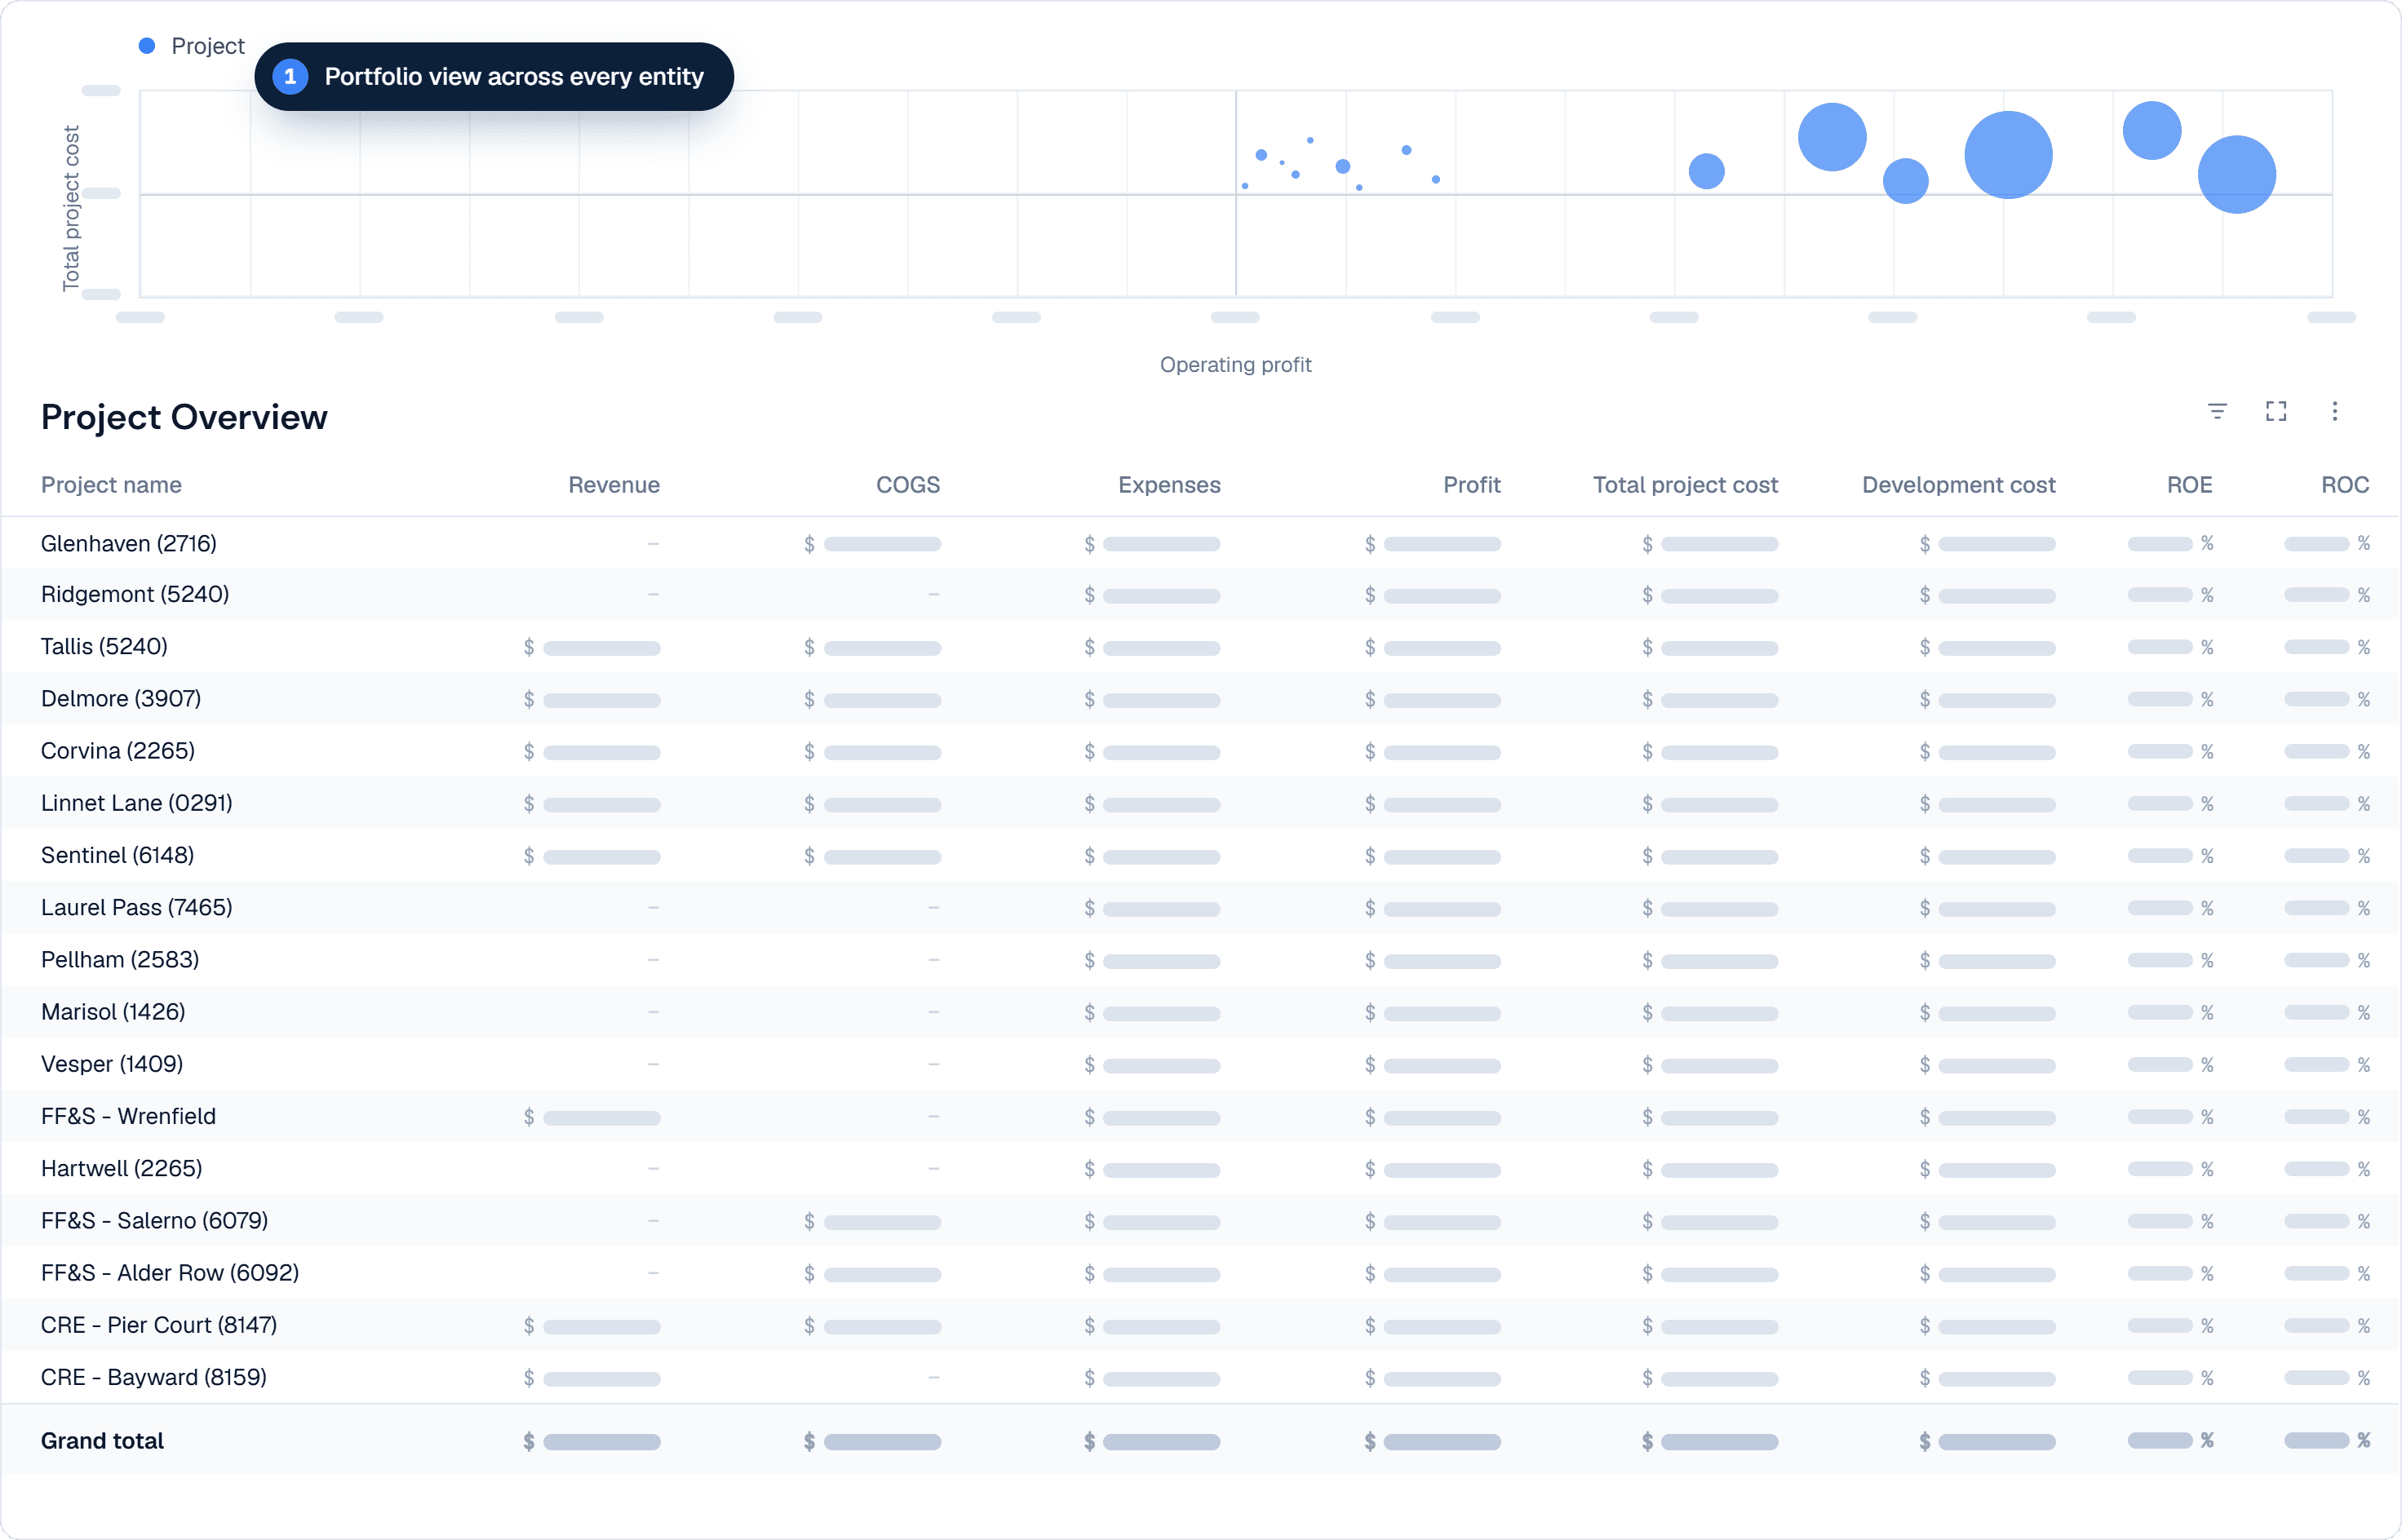
The overview is refreshed automatically every week, and on request from the controller, who works mostly during account closing. The controller reviews it first, looking for projects whose numbers do not match their stage: a development asset still open after a sale, a cost booked to the wrong project, an equity balance that does not reflect a co-investor contribution. The owners then review the same page. Because every project uses the same template, the questions are the same each month: what has this project cost, what has it earned, and what is still on the balance sheet.
Connected AI models do the retrieval work during that review. When a number on the overview looks wrong, the controller or an owner asks the question directly in ChatGPT, Codex or Claude: which entries make up Development Cost on this project, what is making contributions between the partners uneven, which contractor was paid for the landscaping. The assistant resolves the project, retrieves the supporting records within its permitted scope, and explains the difference in plain language, much quicker than a human. PipeLedger’s AI works at the journal-entry level, helping classify debits and credits correctly so real estate books stay GAAP-compliant, all the way from project accounting to the cash flow statement.
Behind the question, the assistant uses pl_resolve to identify the project or counterparty and pl_query to retrieve records within its permitted scope.
What each project still holds, and how it is funded
Section 3 answers what each project has earned. This view answers what is still invested in each project at a month-end, and how that investment is funded. The Project Financing Overview shows, per project, the capitalized project cost still on the balance sheet, the financing equity and financing debt behind it, total financing, and loan-to-cost.
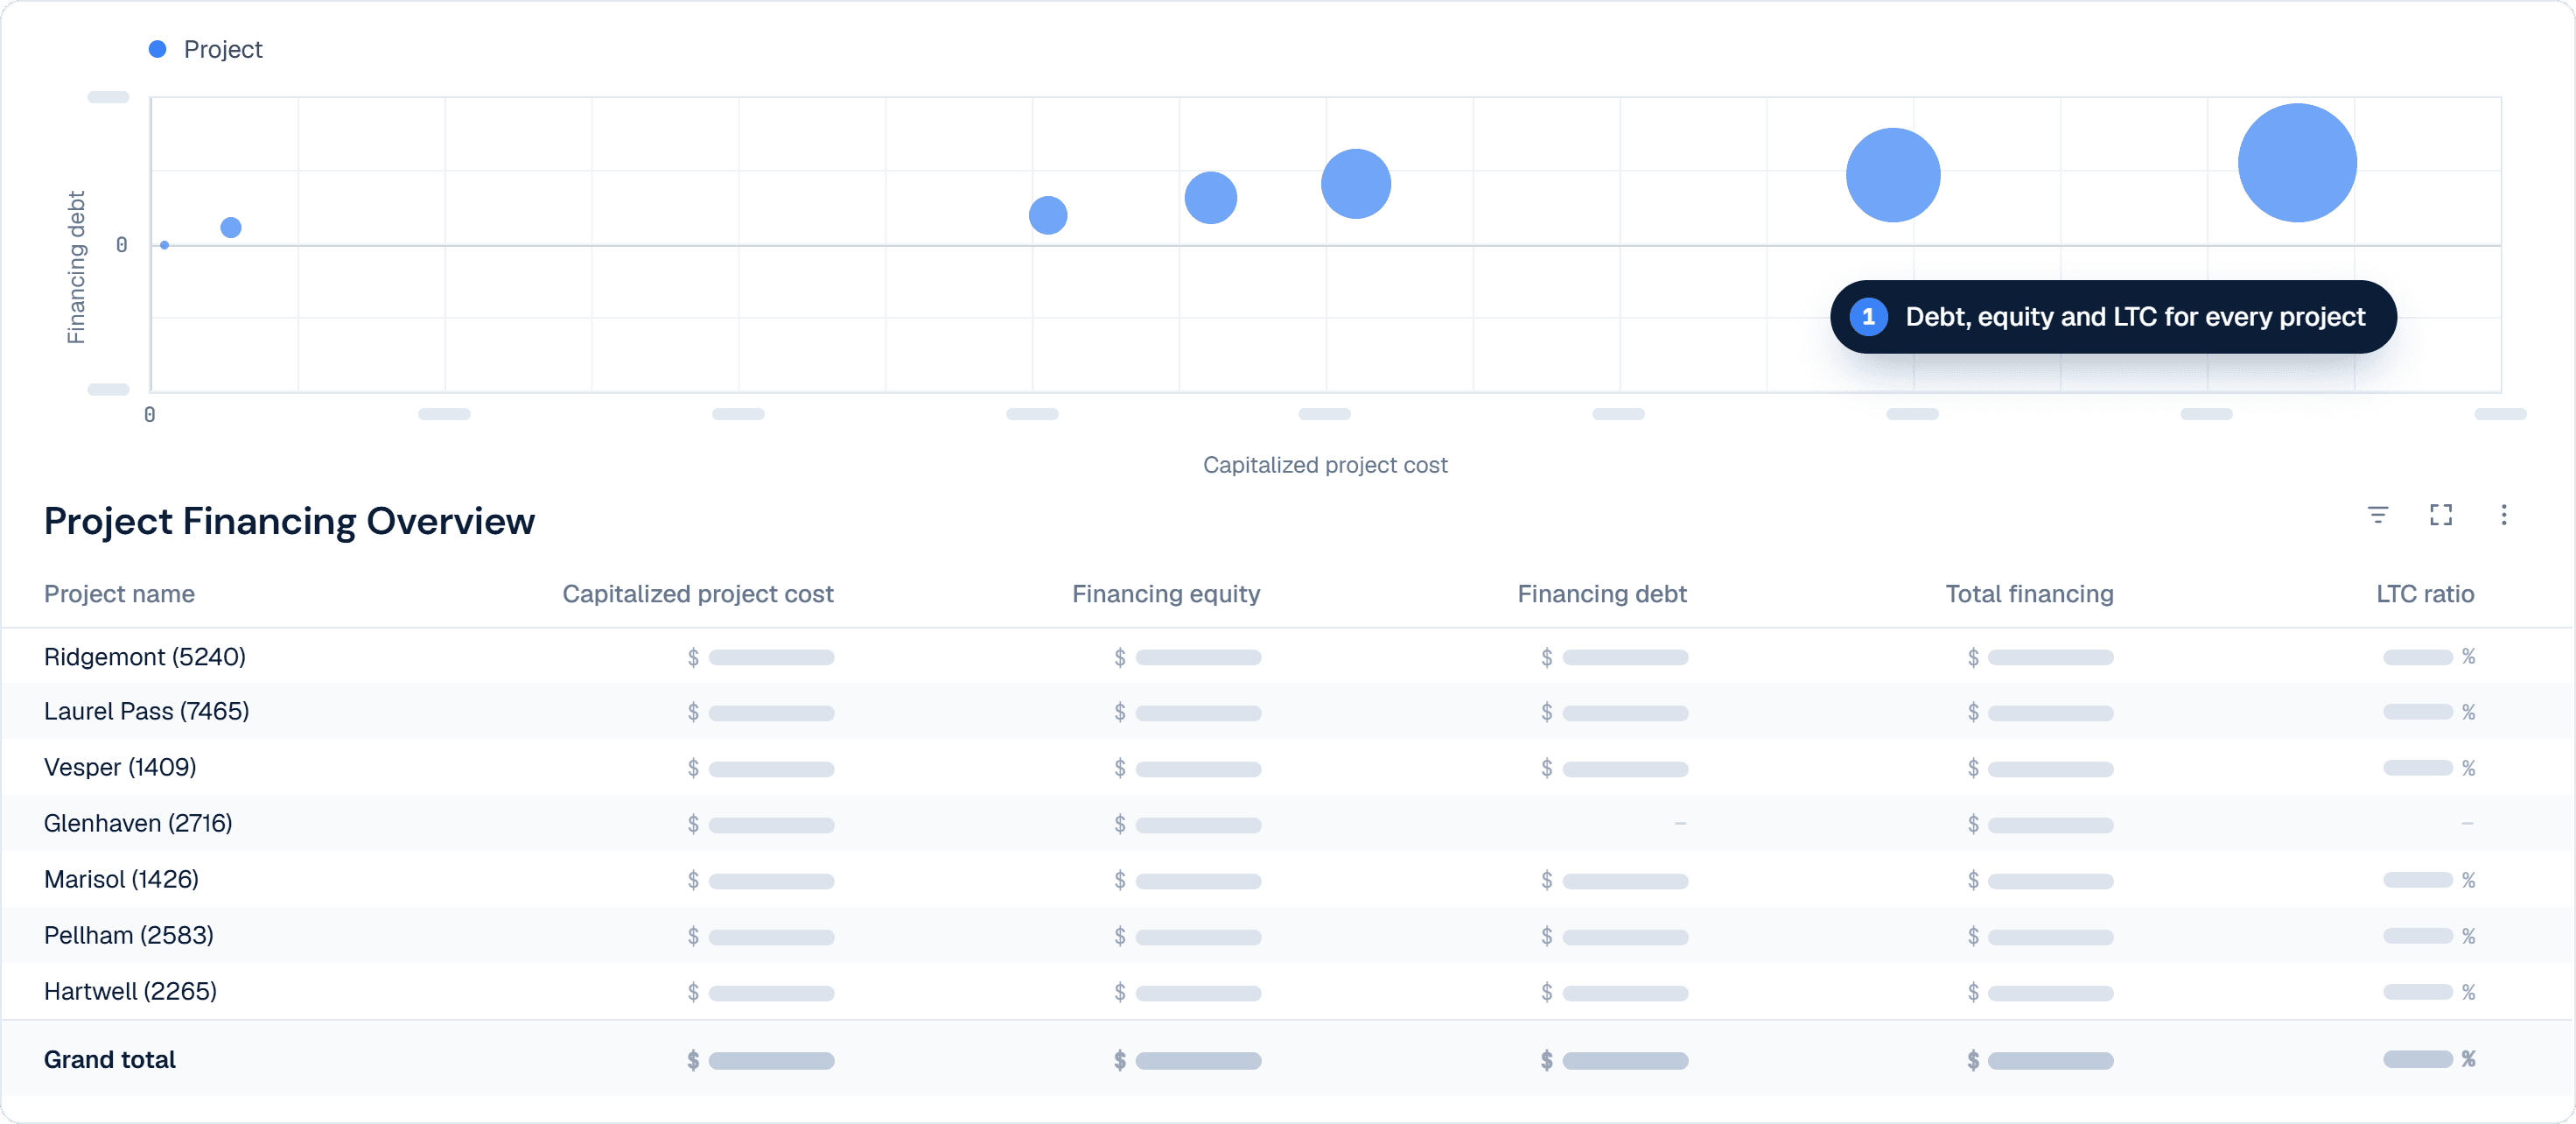
The controller uses this view to follow each project through its lifecycle. During development, capitalized cost and financing grow together. After a sale, cost release, debt repayment, and equity distributions can happen at different times, so the view shows what is still on the books: a capitalized balance not yet released, debt not yet repaid, equity not yet distributed. Each is a prompt to investigate rather than an error by default. The supporting General Ledger records show whether a booking or a classification needs correction, and the next refresh confirms the fix.
Borrowing and owner contributions explain funding; they are not additional project costs. Loan-to-cost compares financing debt with capitalized project cost at the same date. For Ome Dezin, the same figures support the co-investor conversation: each project shows its equity, the debt alongside it, and what remains invested, without anyone reconstructing the numbers from the books.
The five balance metrics behind this view, in the same notation as the project result metrics in section 2:
| Metric | Description | PipeLedger technical formula | What it supports |
|---|---|---|---|
| Capitalized Project Cost | Acquisition and development costs still held as project assets at month-end. | ome_project_capitalized_cost_balance = SUM(ending_balance)source: mart_project_financial_positioninclude: project_economic_role = capitalized_project_cost | See the remaining investment and identify costs that may need releasing after a sale. |
| Financing Equity | Owner and co-investor capital remaining in the selected project-equity accounts at month-end. | financing_equity = SUM(ending_balance)source: mart_project_financial_positioninclude: project_economic_role = financing_equity | Review equity funding attributed to each project. |
| Financing Debt | Borrowing attributed to the project at month-end. | financing_debt = SUM(ending_balance)source: mart_project_financial_positioninclude: project_economic_role = financing_debt | Track outstanding project borrowing separately from other liabilities. |
| Total Financing | The project’s equity and borrowing at the same month-end. | total_financing = financing_equity + financing_debt | Review the funding behind the project alongside its remaining assets. |
| Loan-to-Cost (LTC) | Project debt relative to costs still capitalized at month-end. | loan_to_cost = financing_debt / capitalized_project_costunit: percentage | Understand borrowing relative to the remaining recorded project investment. |
Company returns that support the next financing conversation
For a developer seeking additional funding, a banker or co-investor needs an understandable account of the business behind the next project. Cash, debt, equity, and returns become more useful when the controller can explain their definitions and connect them to reviewed books. That reporting gives lenders and co-investors a clearer basis for discussing the next project.
Thoughtful development takes time. A property may be acquired in one year, restored in the next, and sold later. Sales can therefore make a single year's income change sharply even while the team continues its work. Ome Dezin added a trailing 24-month view to give those longer project cycles more context and smooth some of the timing effects of individual sales.
Ome Dezin added five trailing 24-month metrics: 24-month Net Income, Average Book Equity, Average Assets, and annualized returns on those two average balances. Each return uses the full 24-month income divided by the average of 24 month-end balances, then multiplied by one-half for linear annualization.
The company view also shows bank cash, Total Assets at book value, and Financing Debt before netting cash. Together they explain liquidity, the recorded asset base, and borrowing. Financing Debt selects borrowing accounts; it is not a synonym for all liabilities.
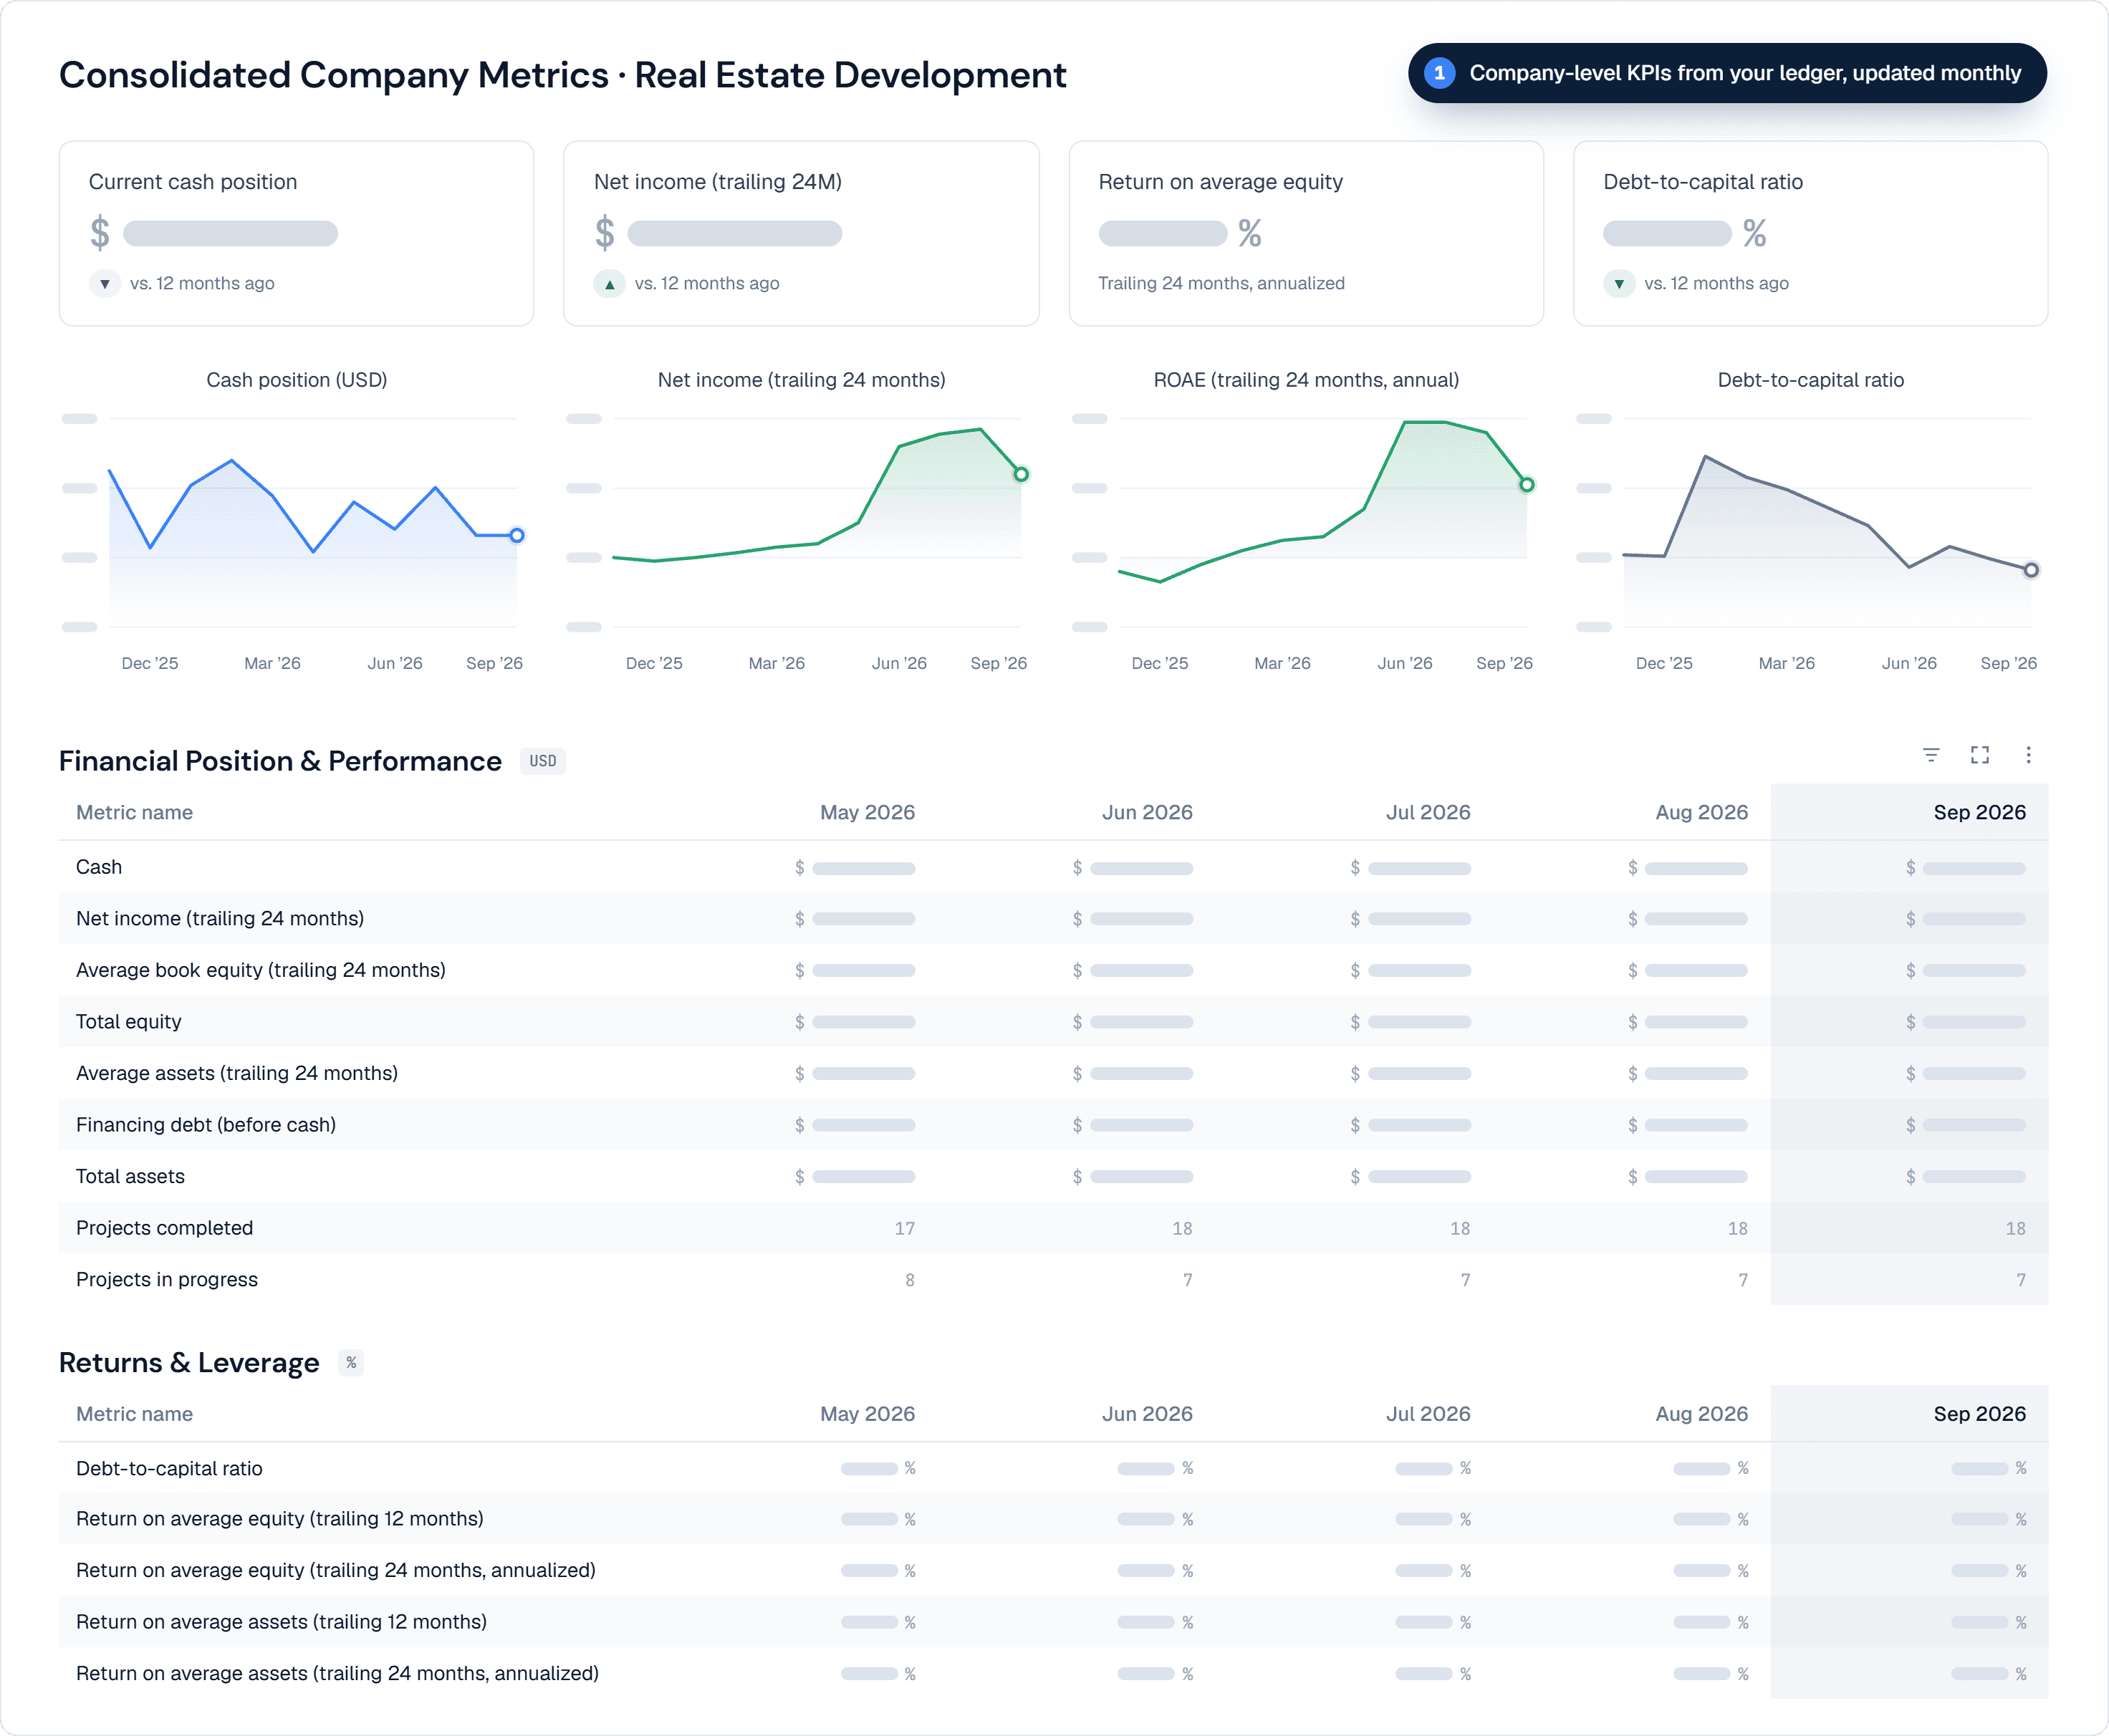
The company page presents month-end figures in three layers: four headline figures with their change against twelve months earlier, a trend for each over the past year, and monthly tables of the amounts and the returns. Two rows are operational measures. Projects completed and Projects in progress come from PipeLedger’s Unit Register, so the owners see the number of projects next to the capital behind them.
| Metric | Description | PipeLedger technical formula | What it supports |
|---|---|---|---|
| Cash | Recorded bank balances at month-end. | cash = SUM(ending_balance)source: canonical Finance Catalog metricinclude: Bank accounts | Review the cash position across the selected LLCs. |
| Net Income — Trailing 24 Months | Recorded earnings across the latest 24 reporting months. | ome_t24m_net_income = SUM_WINDOW(net_income)window: trailing_24_months | Put individual property sales in the context of a longer development cycle. |
| Total Equity | Book equity at month-end, including current-year earnings. | total_equity = SUM(ending_balance)source: canonical Finance Catalog metricinclude: equity accounts + current-year earnings | Understand the company’s recorded equity base. |
| Average Book Equity — Trailing 24 Months | Average book equity supporting the business over the same 24-month window. | ome_t24m_average_book_equity = AVERAGE_MONTH_END(total_equity)window: trailing_24_months | Show the capital base used in the 24-month equity return. |
| Total Assets | Assets at their recorded book value at month-end. | total_assets = SUM(ending_balance)source: canonical Finance Catalog metricinclude: asset accounts | Review the recorded asset base behind the business. |
| Average Assets — Trailing 24 Months | Average book assets over the same 24-month window. | ome_t24m_average_assets = AVERAGE_MONTH_END(total_assets)window: trailing_24_months | Show the asset base used in the 24-month asset return. |
| Financing Debt | Borrowing at month-end, before deducting cash; excludes other liabilities. | ome_financing_debt = SUM(ending_balance)source: mart_gl_trial_balanceinclude: project_economic_role = financing_debt | Explain outstanding borrowing to owners, lenders, and co-investors. |
| Debt-to-Capital | The share of debt and book equity represented by borrowing. | ome_debt_to_capital = ome_financing_debt / ome_debt_and_book_equityome_debt_and_book_equity: ome_financing_debt + total_equityunit: percentage | Review the company’s funding mix. |
| Return on Average Equity — Trailing 12 Months | Twelve-month earnings relative to the average of opening and closing book equity. | ome_ttm_return_on_average_book_equity = SUM_WINDOW(net_income) / AVERAGE(OPENING(total_equity), CLOSING(total_equity))window: trailing_12_monthsannualization: noneunit: percentage | Review the latest year’s earnings relative to its equity base. |
| Return on Average Assets — Trailing 12 Months | Twelve-month earnings relative to the average of opening and closing book assets. | ome_ttm_return_on_average_assets = SUM_WINDOW(net_income) / AVERAGE(OPENING(total_assets), CLOSING(total_assets))window: trailing_12_monthsannualization: noneunit: percentage | Review the latest year’s earnings relative to its asset base. |
| Return on Average Equity — Trailing 24 Months, Annualized | Two-year earnings relative to average monthly book equity, expressed as an annualized return. | ome_t24m_return_on_average_book_equity = SUM_WINDOW(net_income) / AVERAGE_MONTH_END(total_equity)window: trailing_24_monthsannualization: linear, 12 / 24unit: percentage | Give longer development cycles more context in financing discussions. |
| Return on Average Assets — Trailing 24 Months, Annualized | Two-year earnings relative to average monthly book assets, expressed as an annualized return. | ome_t24m_return_on_average_assets = SUM_WINDOW(net_income) / AVERAGE_MONTH_END(total_assets)window: trailing_24_monthsannualization: linear, 12 / 24unit: percentage | Explain earnings relative to the assets supporting those longer project cycles. |
| Projects completed | Number of projects completed by month-end, counted in the Unit Register rather than derived from the ledger. | projects_completed = SUM(closing_balance_quantity)source: mart_unit_rollforwardmetric_key: projects_completed | Put the money figures in the context of how many projects have been finished. |
| Projects in progress | Number of projects under way at month-end, from the same Unit Register roll-forward. | projects_in_progress = SUM(closing_balance_quantity)source: mart_unit_rollforwardmetric_key: projects_in_progress | Show how much work is in the pipeline behind the capital deployed. |
What changed for Ome Dezin
The result is a way of working rather than a report. Seven things are different.
- No spreadsheets. The project template, the overviews, and the company metrics come from the QuickBooks books through PipeLedger. Nothing is re-keyed, and there is no workbook to reconcile against the ledger.
- Reporting that co-investors and lenders can rely on. Each project shows its cost, its funding, and its return with the definitions written down, which is the basis for bringing outside capital into the next project.
- Room for more projects and more LLCs. A new entity or project is a connection and a set of tags, not a new template. The warehouse and the definitions scale with the business.
- Scoped access for partners, project managers, and contractors. PipeLedger’s credential system shares each LLC’s reporting with the partner in that LLC, and gives project managers and contractors a scoped view of their project’s actual costs as they are published.
- Owner controlling across every project. The owners review all projects on one page, ask the same questions each month, and follow any number back to its entries.
- A faster close. With AI-assisted reconciliation, the hourly-paid controller spends significantly less time on the close than before, and a refresh on request shows a correction the same day.
- A clean handover to the CPA. Year-end numbers arrive separated by LLC, with each project’s history and supporting entries attached.
For Ome Dezin, the change is a working financial review process: project tracking in QuickBooks, corrected classifications, shared definitions, and AI assistance for monthly reconciliation. The dashboard makes the results accessible; the supporting records let owners and the controller follow the explanation back to the books.
The real estate project reporting guide explains how to adapt these definitions to your accounts, entities, and project history.